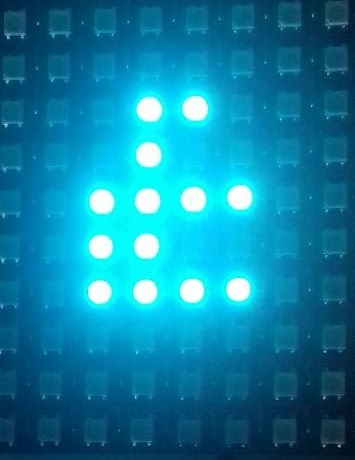
Python code to enable x,y plotting from the neopixel service, an inviting rabbit hole.
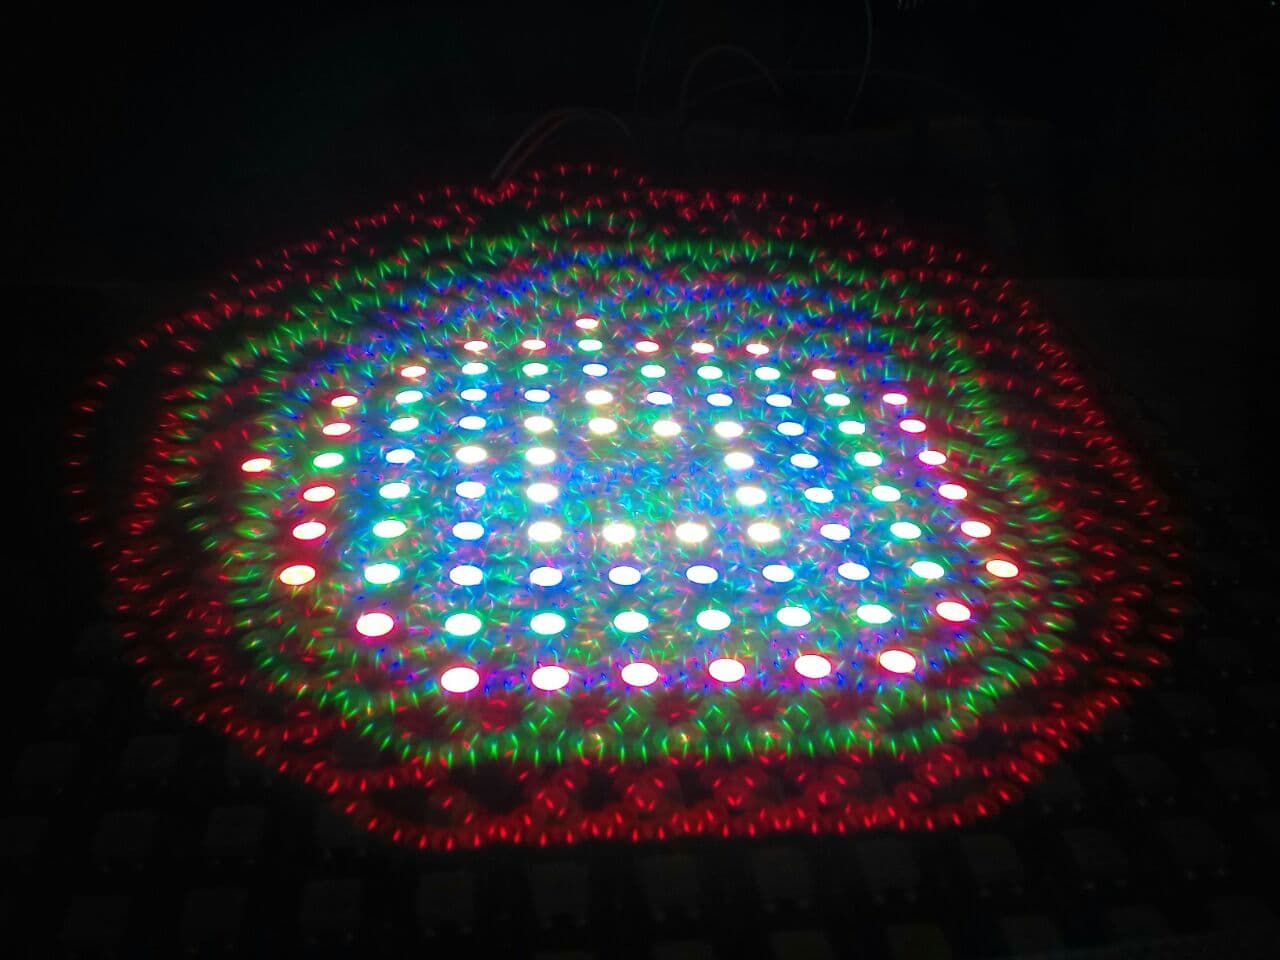
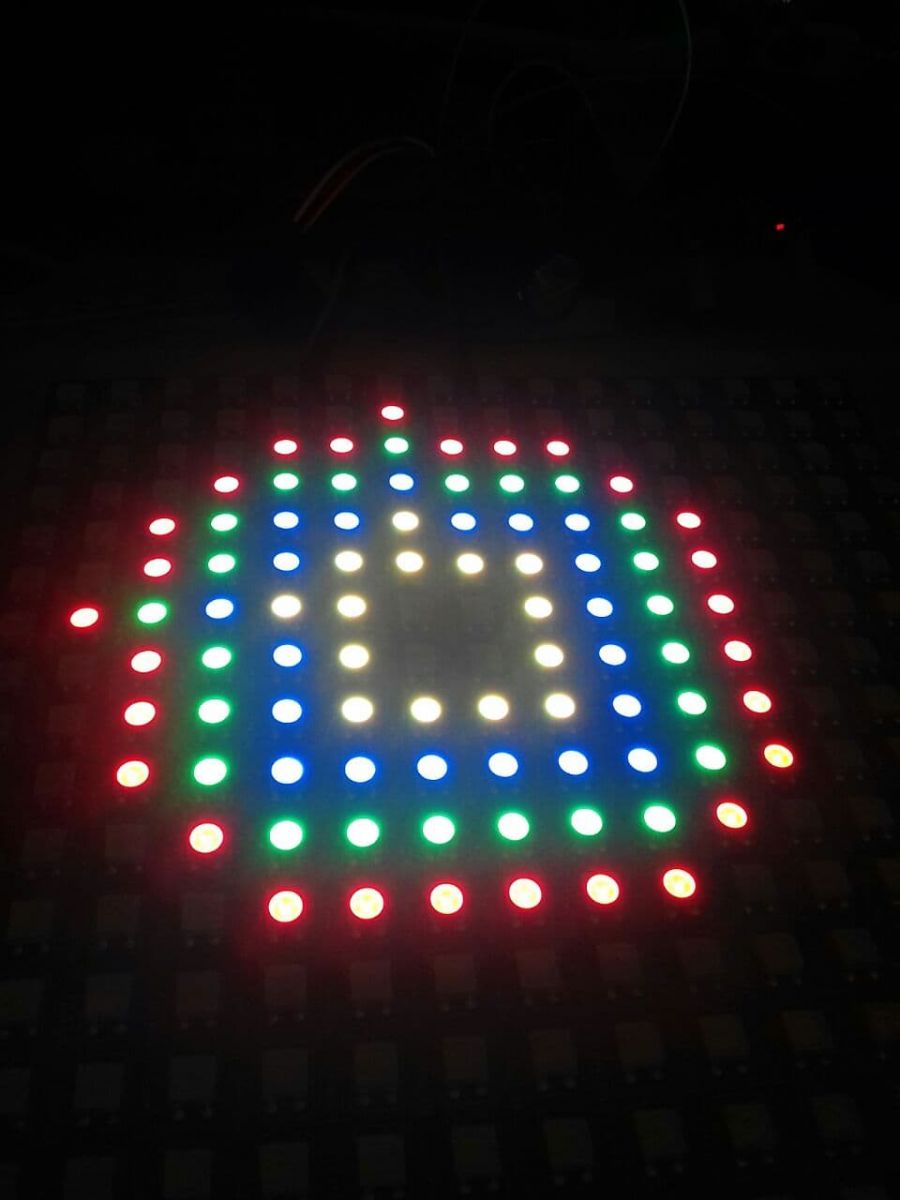
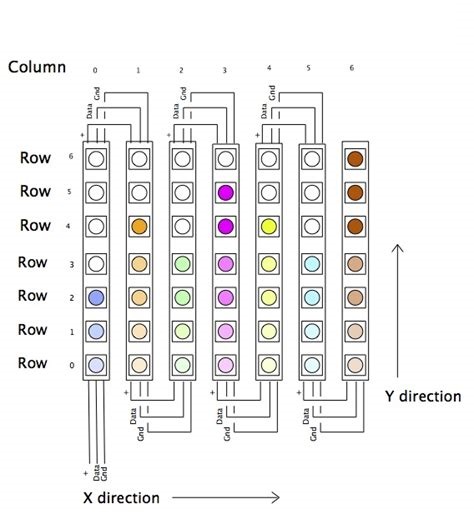
Many Matrix displays have a serpentine LED pattern. This means that odd and even columns are reversed.
The code below unravels the switching of the columns, all you have to do is feed the x and y coords in and the code will determine the pixel that needs to be displayed. The highlighted text indicates this conversion.
Usage - Call the definition :- def XYtoPixel(x,y,r,g,b): #supply x,y, and rgb colour
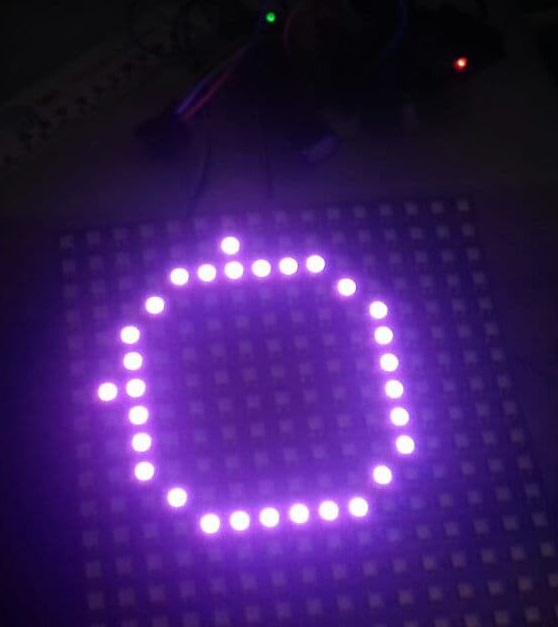
| Python sketch for a 16*16 Neopixel display |
|
import math port = "COM15" pin = 3 pixelCount = 216 # starting arduino arduino = Runtime.start("arduino","Arduino") arduino.connect(port) # starting neopixle # attach the two services def XYCircle(radiusx,radiusy,r,g,b): #Test code for drawing circle def XYtoPixel(x,y,r,g,b): #supply x,y, and rgb colour XYCircle(6,6,255,0,255) #Plot the circles expects x and y radii + RGB colours |
With x,y plotting, its also possible to place and add text/numbers (maybe as debug tool - for displaying startup messages)
Coming soon :- (erhmmmm with reversal)
